
💡 Key Takeaways
- Three report formats: PDF for presentations, Excel for analysis, CSV for integrations.
- Deep analysis: Combining ClikBy data with CRM to calculate ROI.
- BI integrations: Connection to Power BI, Tableau and other systems.
How to Export Reports from ClikBy
Dashboards in ClikBy are your command center for getting operational information. They clearly show what's happening with your traffic right now. But what if you need to dig deeper? What if you want to combine click data with sales data from your CRM? Or build a custom report for management?
That's why ClikBy has a data export function. Exporting reports in PDF, Excel, CSV format is your key to limitless analysis possibilities. It's a transition from simply observing statistics to deep understanding of business processes.
Let's figure out how it works and what opportunities it opens.
Step 1: How and Where to Download Report?
Getting data about your links is very simple. You need to:
1. Open "Smart Links" Section
Then in the section select the desired link and click the three dots on the right side of the screen. After clicking, you'll see a menu, here you need to click on "Statistics":

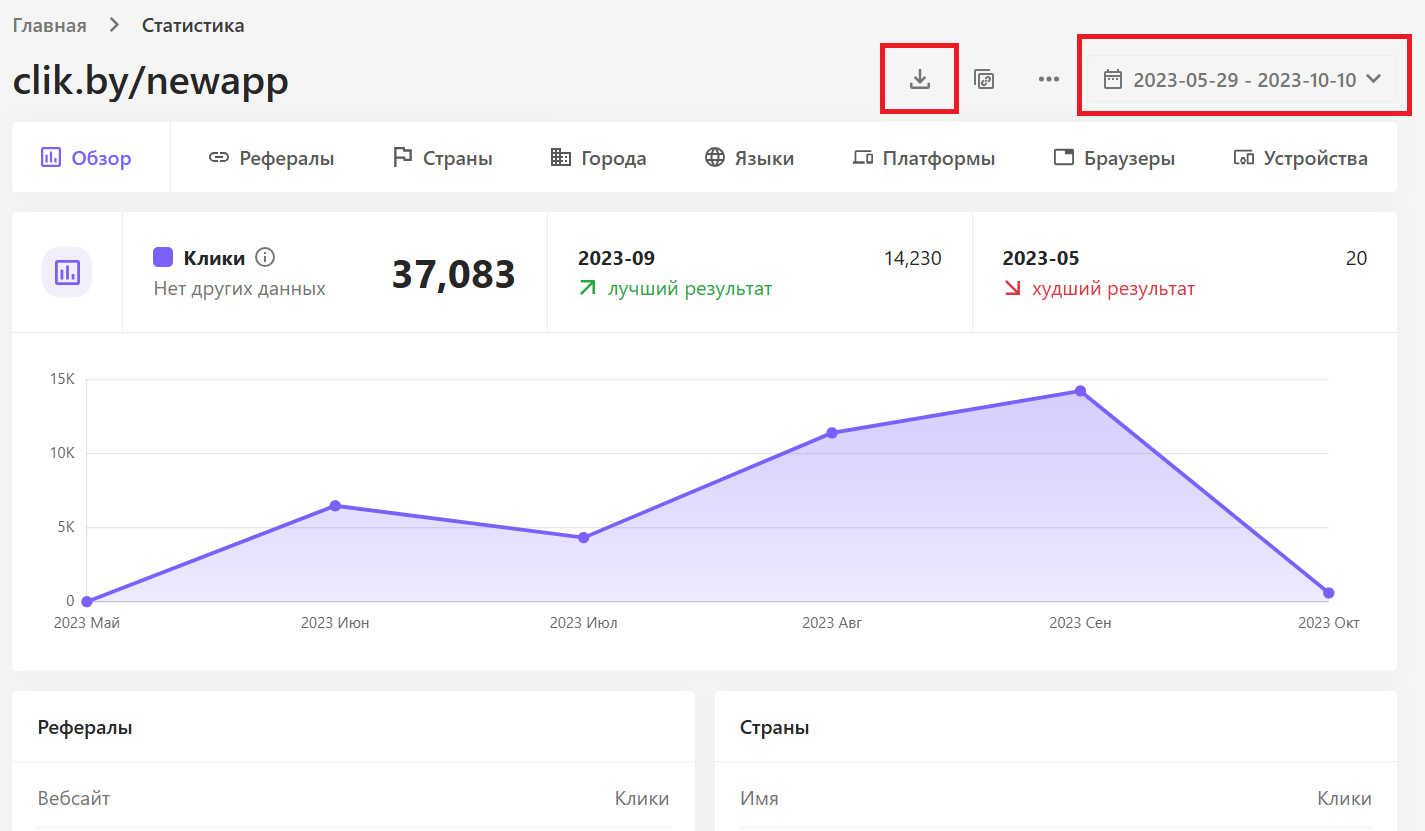
2. On the "Statistics" Page
Here all necessary information about the link is presented. To get data for a specific period, select the desired one in the box at the top right, then click the "Download Report" button, choosing the desired file format: PDF, Excel or CSV:
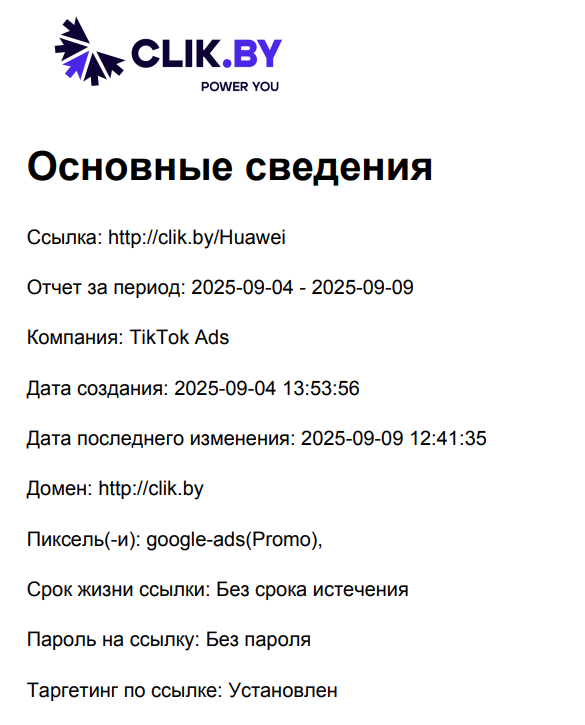
3. PDF Reports
Downloading PDF file you get an A4 format document with several pages containing important information about Basic Information, as well as information of the following nature: Clicks, Referrers (TOP-10), Cities (TOP-10), Countries (TOP-10), Languages (TOP-10), Platforms (TOP-10), Browsers (TOP-10) and Devices (TOP-10). The document looks like this:
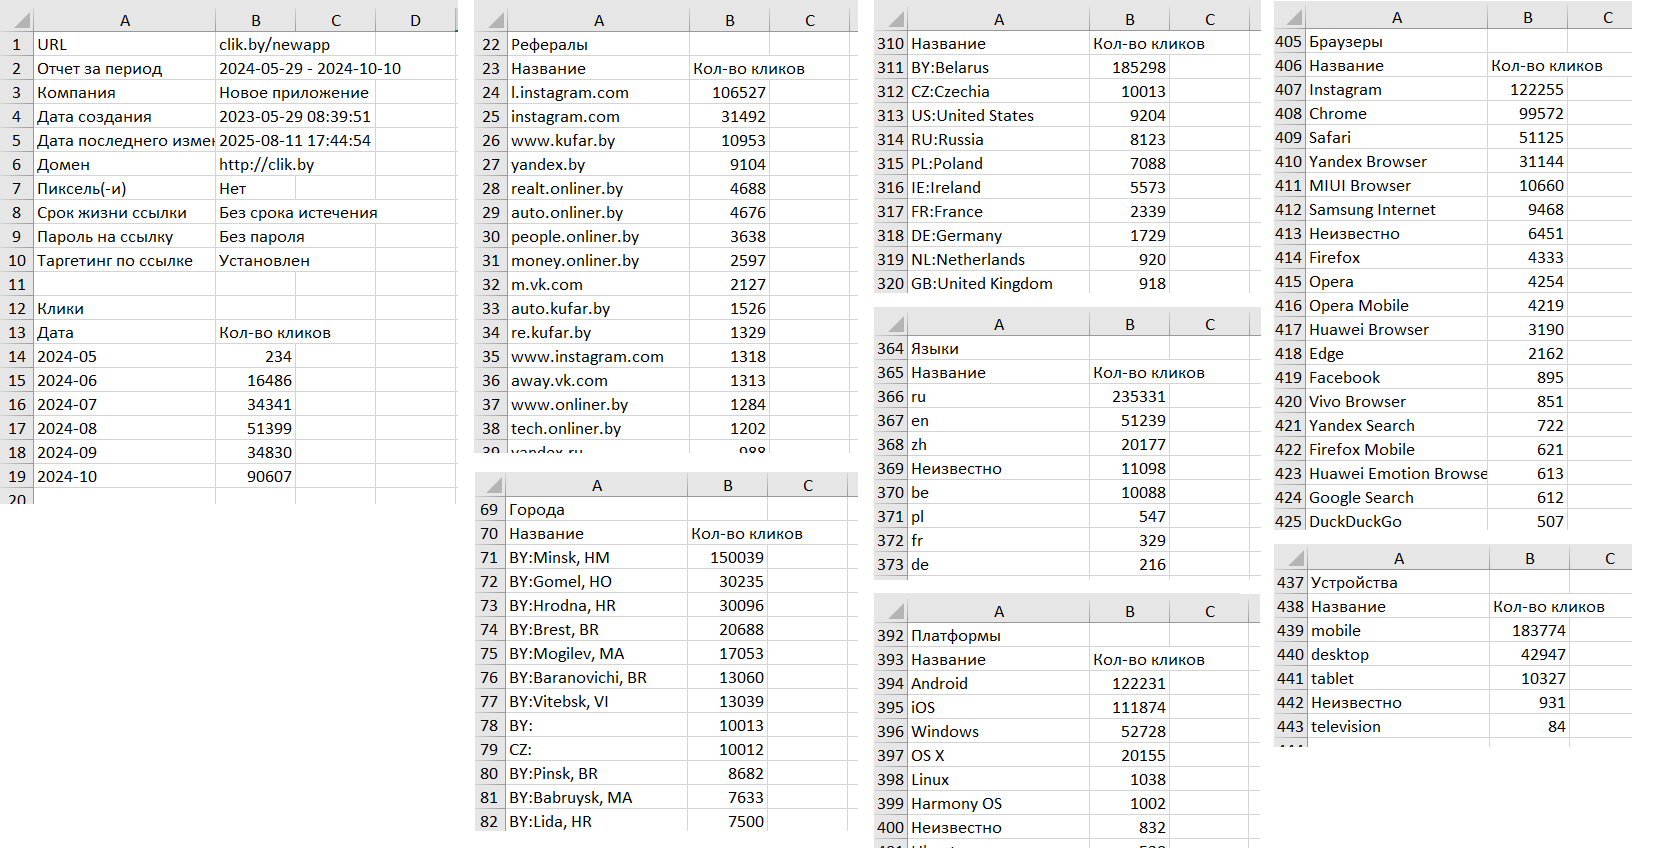
4. Excel Reports
Downloading Excel file you get an Excel table where column A contains data explanations and column B - number of clicks (for convenience the table is shown horizontally):
5. CSV Reports
Downloading CSV file you get a CSV table with data (almost identical to the Excel table).
What is CSV?
CSV (Comma-Separated Values) is a universal text format for tabular data. Its main advantage is that it opens in any spreadsheet editor (Microsoft Excel, Google Sheets) and is easily imported into any analytical system (Power BI, Tableau, Google Data Studio).
Step 2: Analysis in Excel / Google Sheets — Extracting Gold from Data
Once you've opened the CSV file in Excel or Google Sheets, huge analysis opportunities open up before you.
Here are just a few techniques you can use:
Cross-Analysis of Data
ClikBy shows you clicks by country and clicks by device separately. But what if you want to know which device users (iOS or Android) click more often in each specific country?
Example: You create a pivot table where rows will have "Countries", columns — "Device Type", and values — "Number of Clicks". In a minute you get an insight: in Belarus your main audience is Android users, while from Germany they come primarily from iPhone. This is a direct indication of how to adapt creatives for targeting different geos.
Custom Visualization
You can build any charts you need for presentations or internal analysis.
Example: Create a pie chart to clearly show the share of each referrer (traffic source) in the total click volume. Or build a histogram comparing the effectiveness of advertising campaigns grouped by your Tags.
Integration with Sales Data
The report exported from ClikBy is only half the story. The other half is your sales data.
Example of Full ROI Analysis:
- You export a report from ClikBy for all your links for the month. You have a "Link Name" column and "Number of Clicks".
- From your CRM system you export a sales report that indicates which advertising link the client came from.
- In Excel you combine these two tables by the common link identifier.
- You add your columns: "Number of Leads", "Number of Sales", "Sales Amount".
- You create calculated columns:
- Lead Conversion (%) = (Number of Leads / Number of Clicks) * 100
- Cost Per Lead (CPL) = (Channel Costs / Number of Leads)
- Return on Investment (ROI) = (Sales Amount - Costs) / Costs * 100
Result: Before you is a complete financial report on the effectiveness of each of your channels and each of your links. You see not just clicks, but real money. You know exactly that the link from the native article at partner N brought 500 clicks and 3 sales with 250% ROI, while the link from Facebook targeting — 2000 clicks and 1 sale with -10% ROI. The decision about budget optimization becomes obvious.
Step 3: Loading into BI Systems (Power BI, Tableau, Looker Studio)
For large companies with established end-to-end analytics, CSV files from ClikBy are an invaluable data source.
Example: Your analyst can set up loading reports from ClikBy into your BI system. There this data is combined with information from Google Analytics, advertising accounts, CRM and call tracking systems. As a result, you get a live interactive dashboard where management can see the complete business picture in real-time — from a link click to final profit.
Also for Enterprise clients we have API access. Write to us at info@clik.by and we'll calculate the cost of the necessary integration!
Conclusion
Don't limit yourself to standard reports on the dashboard. The data export function in ClikBy is your Swiss army knife for deep analytics. It allows you to:
- Build any custom reports.
- Find hidden insights in data.
- And most importantly — directly link clicks with money, proving the effectiveness of your marketing efforts.
Data is your new oil, and ClikBy gives you all the tools for its extraction and processing.