




Key takeaways
- Three formats: PDF — presentations, Excel — analysis, CSV — integrations.
- Deep analysis: combining with CRM for ROI.
- BI: Power BI, Tableau, Looker Studio.
How to export reports from ClikBy
Dashboards give an operational picture «right now». PDF / Excel / CSV export is needed when you must join clicks with CRM sales or assemble a custom report for leadership.
This is the shift from watching stats to understanding business processes.
Step 1: How and where to download a report?
1. The «Smart links» section
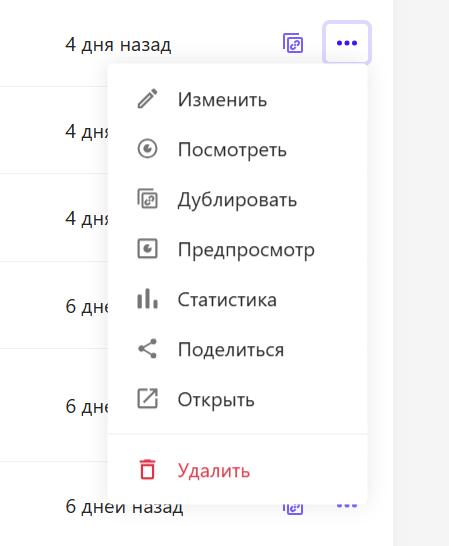
Select a link → three dots on the right → «Stats».
2. The «Stats» page
Select the period at the top right → «Download report» → PDF, Excel, or CSV.

3. PDF
A4 document: key facts, clicks, TOP‑10 referrers, cities, countries, languages, platforms, browsers, and devices.

4. Excel
Table: explanations in column A, visit counts in B.

5. CSV
Almost like Excel. CSV opens in any spreadsheet editor and imports easily into Power BI, Tableau, Looker Studio.
Step 2: Analysis in Excel / Google Sheets
Cross-analysis
Clicks by country and by device separately — in a pivot you can see iOS vs Android per country and adapt creatives.
Visualization
Pie charts by referrers, histograms by campaign tags.
ROI with CRM
Пример: a ClikBy report (link name + clicks) + CRM sales → lead conversion, CPL, ROI. You see which link brings money and which burns budget.
Step 3: BI systems
For end-to-end analytics, CSV from ClikBy is loaded into BI together with GA, ad accounts, CRM, and call tracking — a live dashboard from click to profit.
Enterprise: API — write to info@clik.by for an integration estimate.
Вывод
- Any custom reports
- Hidden insights in the data
- The link between clicks and money — proof of marketing effectiveness
Data is your oil; ClikBy gives the tools to extract and refine it.